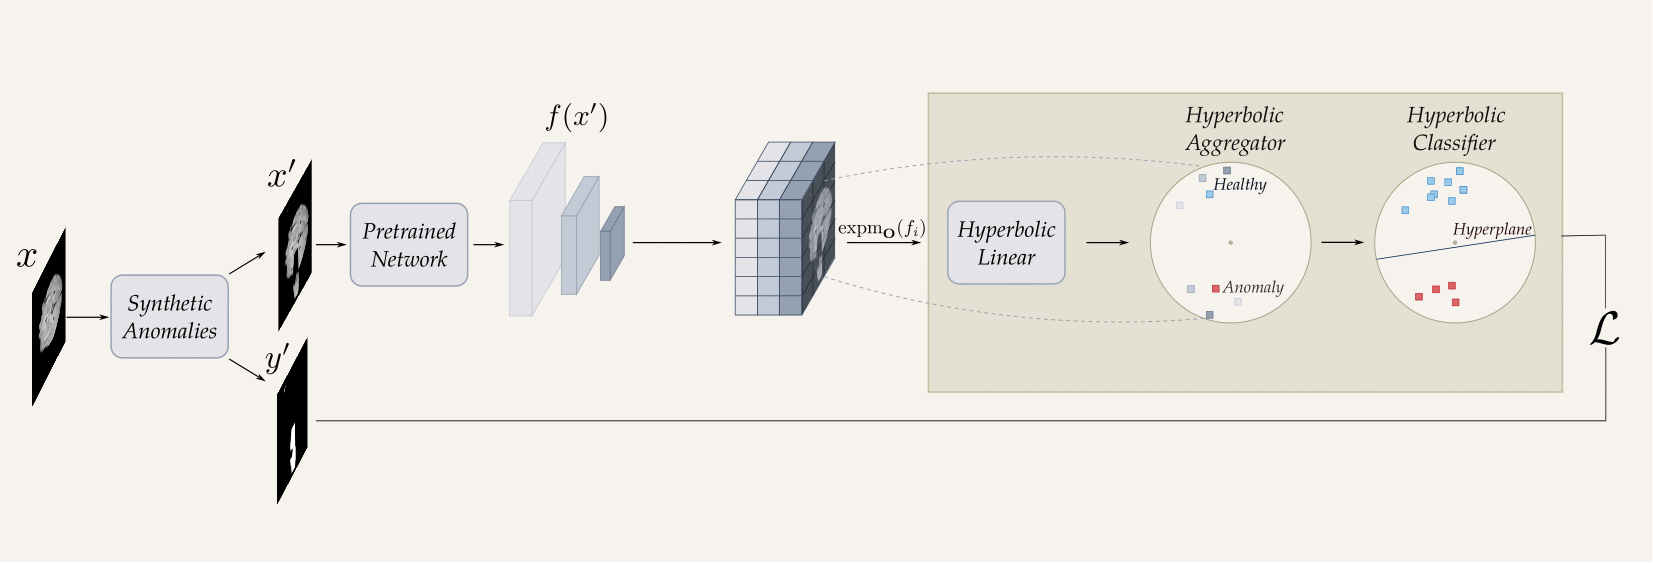
Medical anomaly detection has emerged as a promising solution to challenges in data availability and labeling constraints. Traditional methods extract features from different layers of pre-trained networks in Euclidean space; however, Euclidean representations fail to effectively capture the hierarchical relationships within these features, leading to suboptimal anomaly detection performance. We propose a novel yet simple approach that projects feature representations into hyperbolic space, aggregates them based on confidence levels, and classifies samples as healthy or anomalous. Our experiments demonstrate that hyperbolic space consistently outperforms Euclidean-based frameworks, achieving higher AUROC scores at both image and pixel levels across multiple medical benchmark datasets. Additionally, we show that hyperbolic space exhibits resilience to parameter variations and excels in few-shot scenarios, where healthy images are scarce. These findings underscore the potential of hyperbolic space as a powerful alternative for medical anomaly detection.
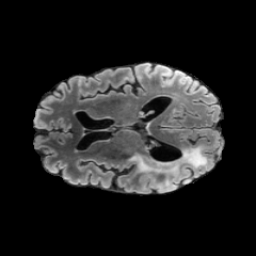
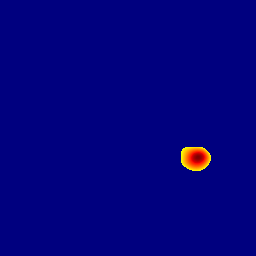
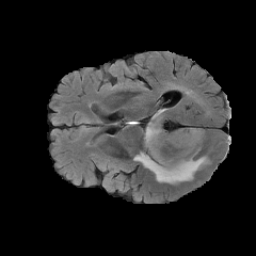
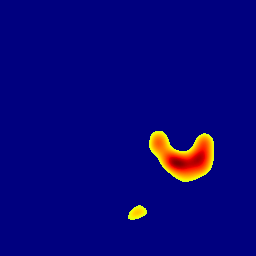
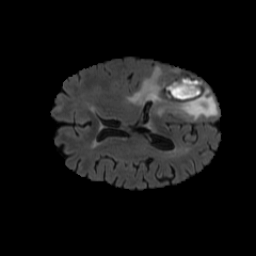
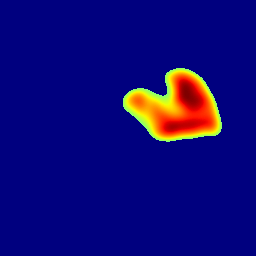
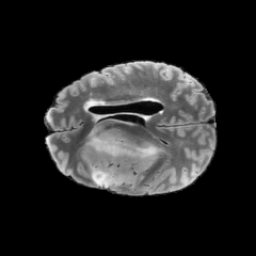
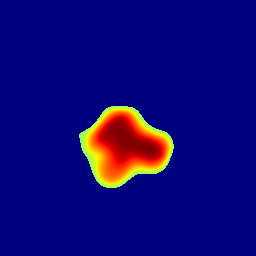
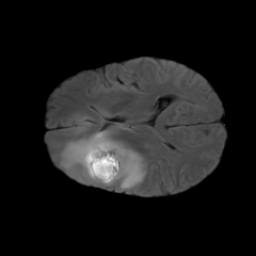
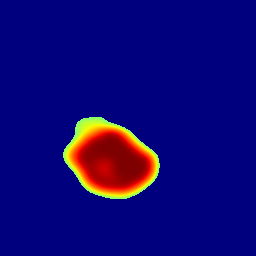
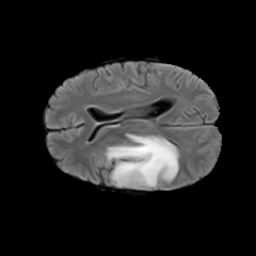
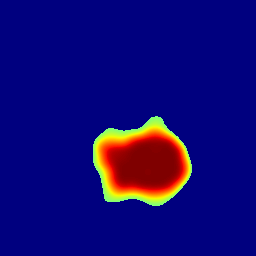
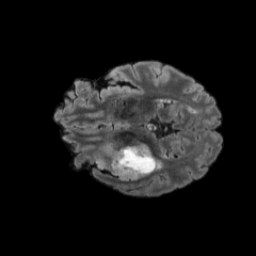
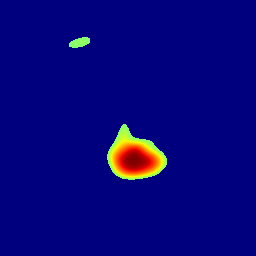
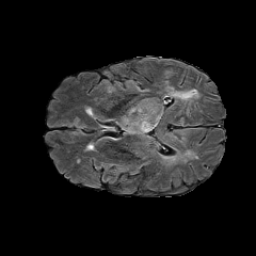
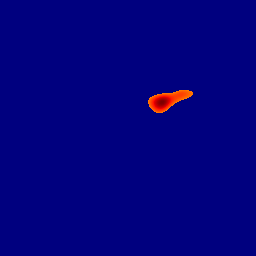
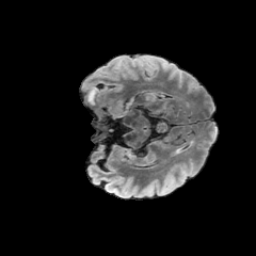
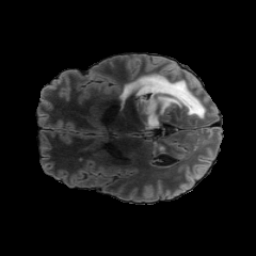
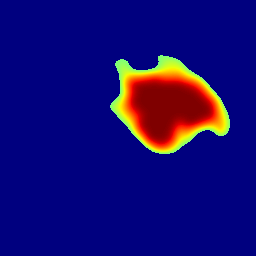
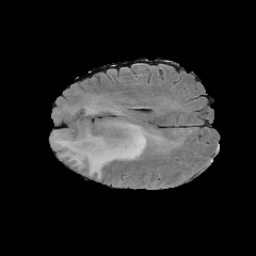
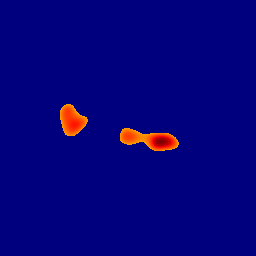
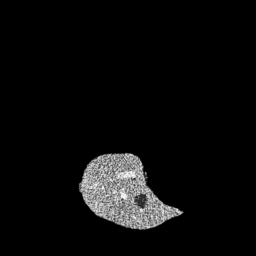
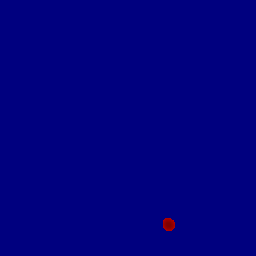
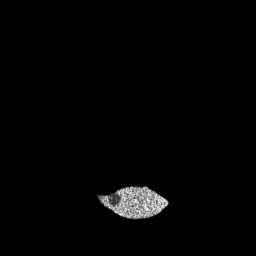
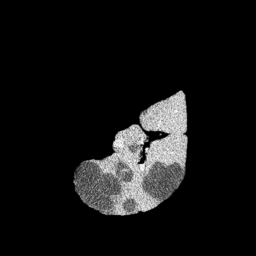
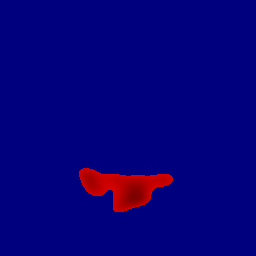
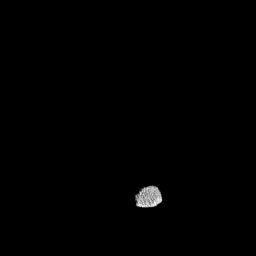
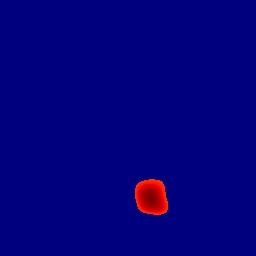
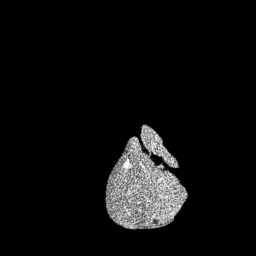
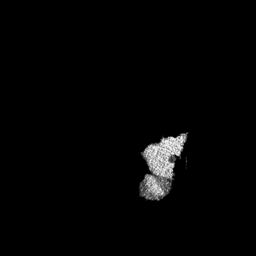
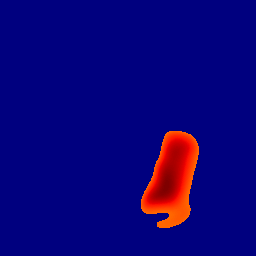
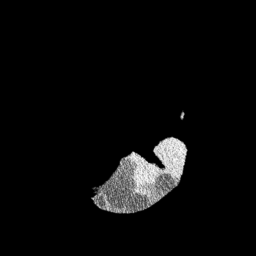
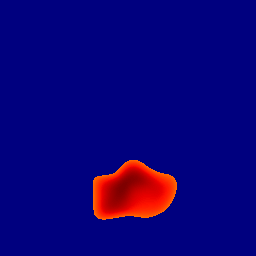
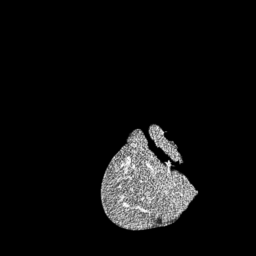
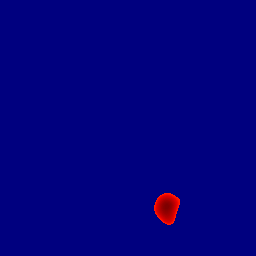
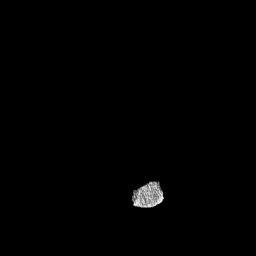
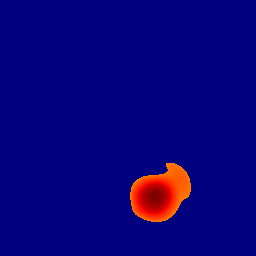
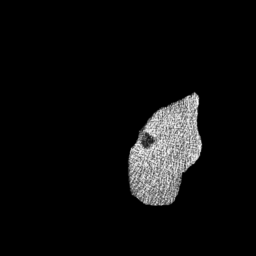
The gallery below showcases a series of prediction results from our anomaly detection model operating in hyperbolic space, applied to the BraTS and Liver datasets. Use the slider and gestures to explore and compare the details on both sides. For transparency, we have also included examples where the model fails to detect lesions.


This section presents the results of anomaly detection and localization on the BMAD benchmark. The evaluation is based on the image and pixel-level AUROC metrics. For each method, the reported values represent the mean, along with the minimum (subscript) and maximum (superscript) performance across five different random seeds.
| Methods | BraTS2021 | BTCV + LiTs | RESC | OCT2017 | RSNA | |||||||
|---|---|---|---|---|---|---|---|---|---|---|---|---|
| IAUROC | PAUROC | IAUROC | PAUROC | IAUROC | PAUROC | IAUROC | IAUROC | |||||
| RD4AD | 89.5288.8590.19 | 96.3696.2496.48 | 59.1453.8364.45 | 91.4091.3091.50 | 88.2586.2590.25 | 96.1895.9896.38 | 94.8892.1797.58 | 67.6366.5368.73 | ||||
| STFPM | 84.2581.8786.63 | 96.0395.6396.43 | 61.4859.8163.15 | 96.2696.1296.40 | 87.2687.0387.49 | 94.9694.9095.02 | 91.8890.5593.21 | 69.3168.2270.4 | ||||
| PaDiM | 79.6278.2880.96 | 94.2293.9994.45 | 50.9150.5851.24 | 90.4890.3390.63 | 75.1573.7376.57 | 91.2290.8591.59 | 90.1789.5690.78 | 74.4874.2274.74 | ||||
| PatchCore | 92.0291.9192.13 | 95.5395.4895.58 | 59.3359.1959.47 | 95.0094.9995.01 | 90.5490.4490.64 | 95.8795.8395.91 | 97.4596.8098.10 | 75.6775.4775.87 | ||||
| CFA | 84.9984.8385.15 | 96.6196.5796.65 | 53.8949.6558.13 | 97.4097.3497.46 | 72.4770.2074.74 | 92.4991.4193.57 | 79.1078.5479.66 | 66.6566.5066.80 | ||||
| Ours | 92.4991.9693.02 | 95.5695.4995.63 | 65.9463.8967.99 | 96.4993.8799.11 | 90.7190.1491.28 | 95.3295.0895.56 | 97.8597.5898.12 | 79.4678.7280.20 | ||||
We further evaluate the robustness of our framework in a few-shot setting, where only a limited number of normal images are available for training. We experiment with {1, 3, 5, 10, 25} normal images and compare our performance against PaDiM and PatchCore. Our hyperbolic model significantly outperforms both baselines, particularly in extreme data scarcity scenarios.
@incollection{gonzalezjimenezIsHyperbolicSpace2025,
  title     = {Is Hyperbolic Space All You Need for Medical Anomaly Detection?},
  author    = {Gonzalez-Jimenez, Alvaro and Lionetti, Simone and Amruthalingam, Ludovic and Gottfrois, Philippe and Gröger, Fabian and Pouly, Marc and Navarini, Alexander A.},
  journal   = {Medical {{Image Computing}} and {{Computer Assisted Intervention}} – {{MICCAI}} 2025},
  publisher = {{Springer International Publishing}},
  year      = {2025},
}